What Codex Actually Sends to the Model
- 10 minsI recorded the requests Codex generated for a 16-character prompt, then measured what changed as it loaded instructions, exposed tools, read files, ran commands, received images, and compacted its history.
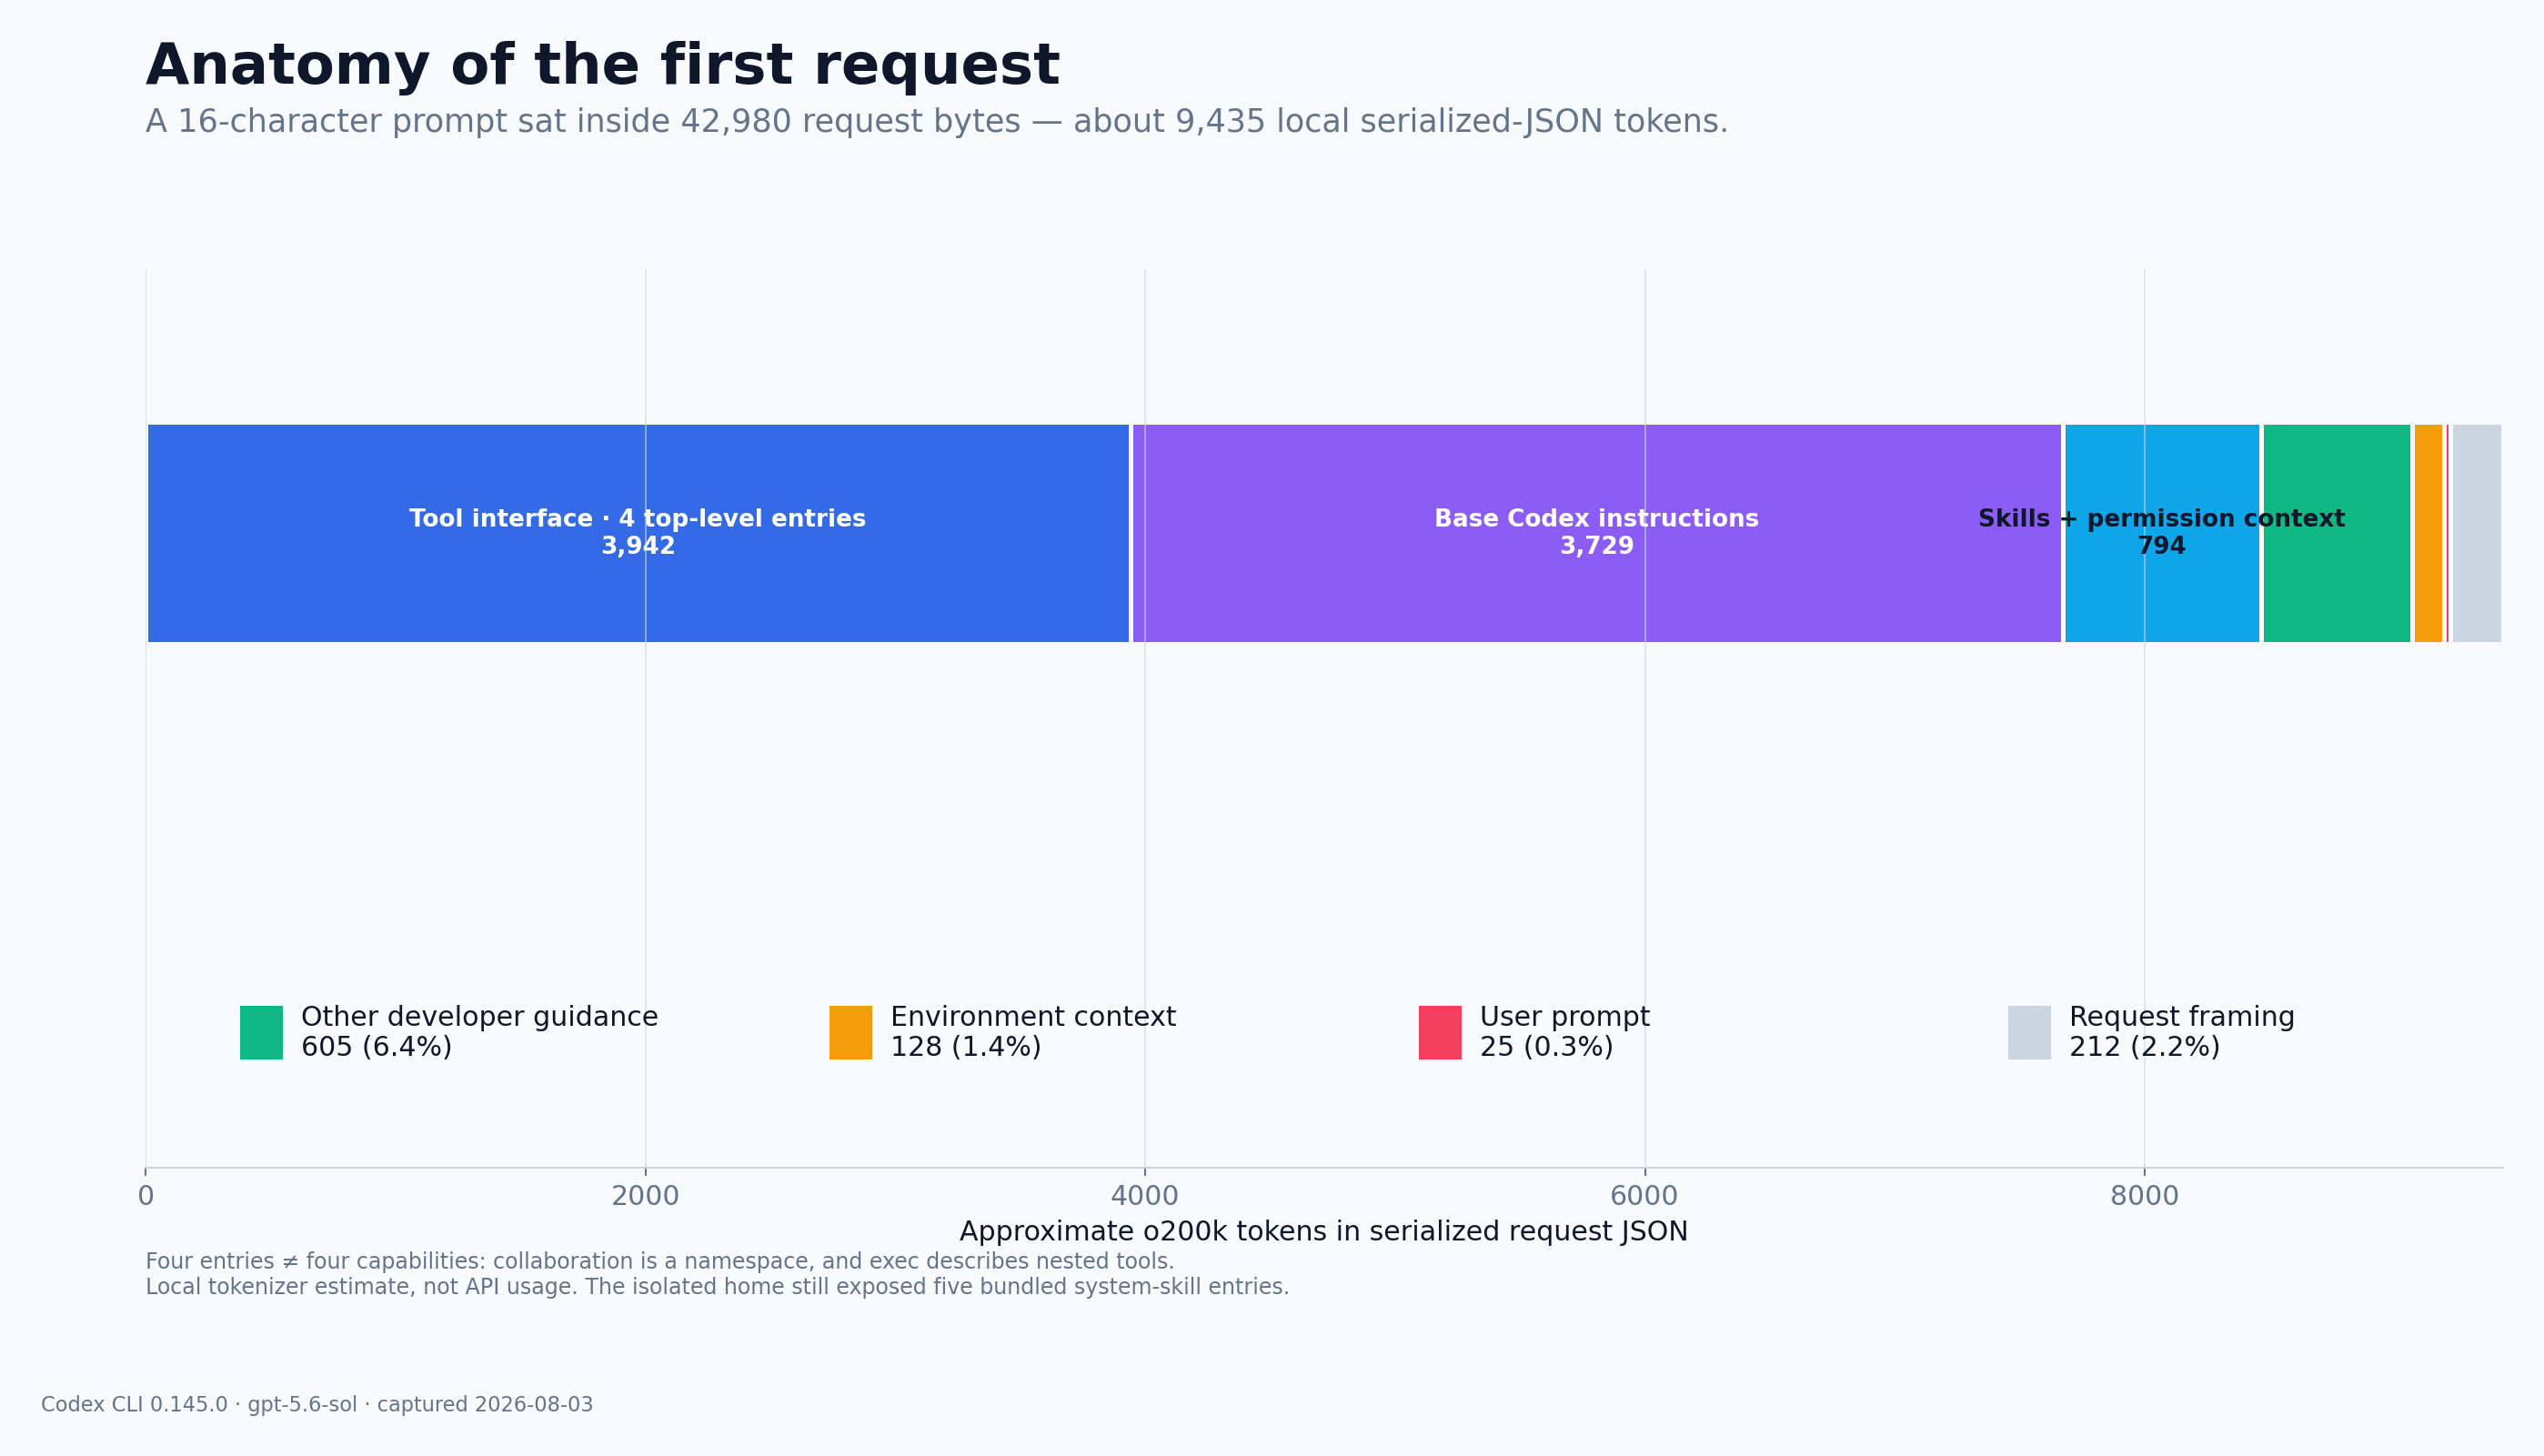
When I typed Reply with pong., the prompt was 16 characters long.
The request Codex sent was 42,980 bytes.
Encoded locally as JSON with o200k_base, it came to roughly 9,435 tokens. The wrapped prompt accounted for about 25 of them, or 0.3%. The rest came from Codex itself: instructions, tool definitions, permissions, skill metadata, environment context, and request framing.
Those token counts are local estimates, not API usage or billing. The captured request body itself is exact.
File reads and command output are added later. When the accumulated history gets too large, Codex can send it through another model request, replace it with a summary, and continue.
How I recorded the requests
Codex supports custom model providers. I pointed it at a local HTTP server that saved each request, redacted sensitive headers, and returned a fixed fake response. The experiment did not call an external model.
Codex client → local recorder → deterministic fake response
                       ↑
                 request saved here
The recorder shows what the client sent. It cannot show what a real provider might change after receiving the request, whether any input would be cached, or how it would be billed.
I measured two things:
- Raw request bytes: the size of the HTTP JSON body before sanitization.
- Approximate text tokens: the sanitized JSON encoded locally with o200k_base.
The tests used Codex CLI 0.145.0 with the gpt-5.6-sol model.
The first request
I started Codex in an empty temporary Git repository, disabled project instructions, and pointed CODEX_HOME at an empty directory.
The request still described five bundled system skills, so this was an isolated-home baseline rather than a minimum possible request.
Three items accounted for 7,696 of the 9,435 tokens:
| What it contained | Serialized size | Local estimate | |
|---|---|---|---|
| additional_tools developer item | Four top-level tool entries | 16,741 characters | 3,942 tokens |
| Developer message | Main Codex instructions | 17,730 text characters | 3,729 tokens |
| User message | Reply with pong. | 16 text characters | 25 tokens |
The four tool entries were exec, wait, request_user_input, and a collaboration namespace. They represented more than four actions. collaboration contained six subtools, while exec described command execution, patching, image inspection, plan updates, and other nested tools.
In this run, Codex placed the tool entries and base instructions inside the input array instead of using top-level instructions and tools fields.
Project instructions
Codex builds its project instruction chain from the repository root to the directory where it starts. It looks for AGENTS.md at each level, placing the closer instructions later.
I created one root and one child AGENTS.md, each with 100 unique markers.
- Starting at the repository root sent all 100 root markers and no child markers.
- Starting in the child directory sent all 200 markers.
- Starting at the root and later running ls child did not add the child instructions.
The launch directory determined the automatic instruction chain. Reading the child file explicitly could still add its contents as ordinary tool history.
For the size test I used synthetic high-entropy markers rather than natural prose. Each marker is a string like PAIRED_AGENTS_1000_0001, which o200k_base splits into 11 tokens on its own. Ordinary prose words do not. The table below shows that instructions are transmitted in full — it is not what your own AGENTS.md would cost.
Larger files changed the first request directly:
| Raw request bytes | Local estimate | Difference from baseline | |
|---|---|---|---|
| Isolated-home baseline | 42,980 | 9,435 | — |
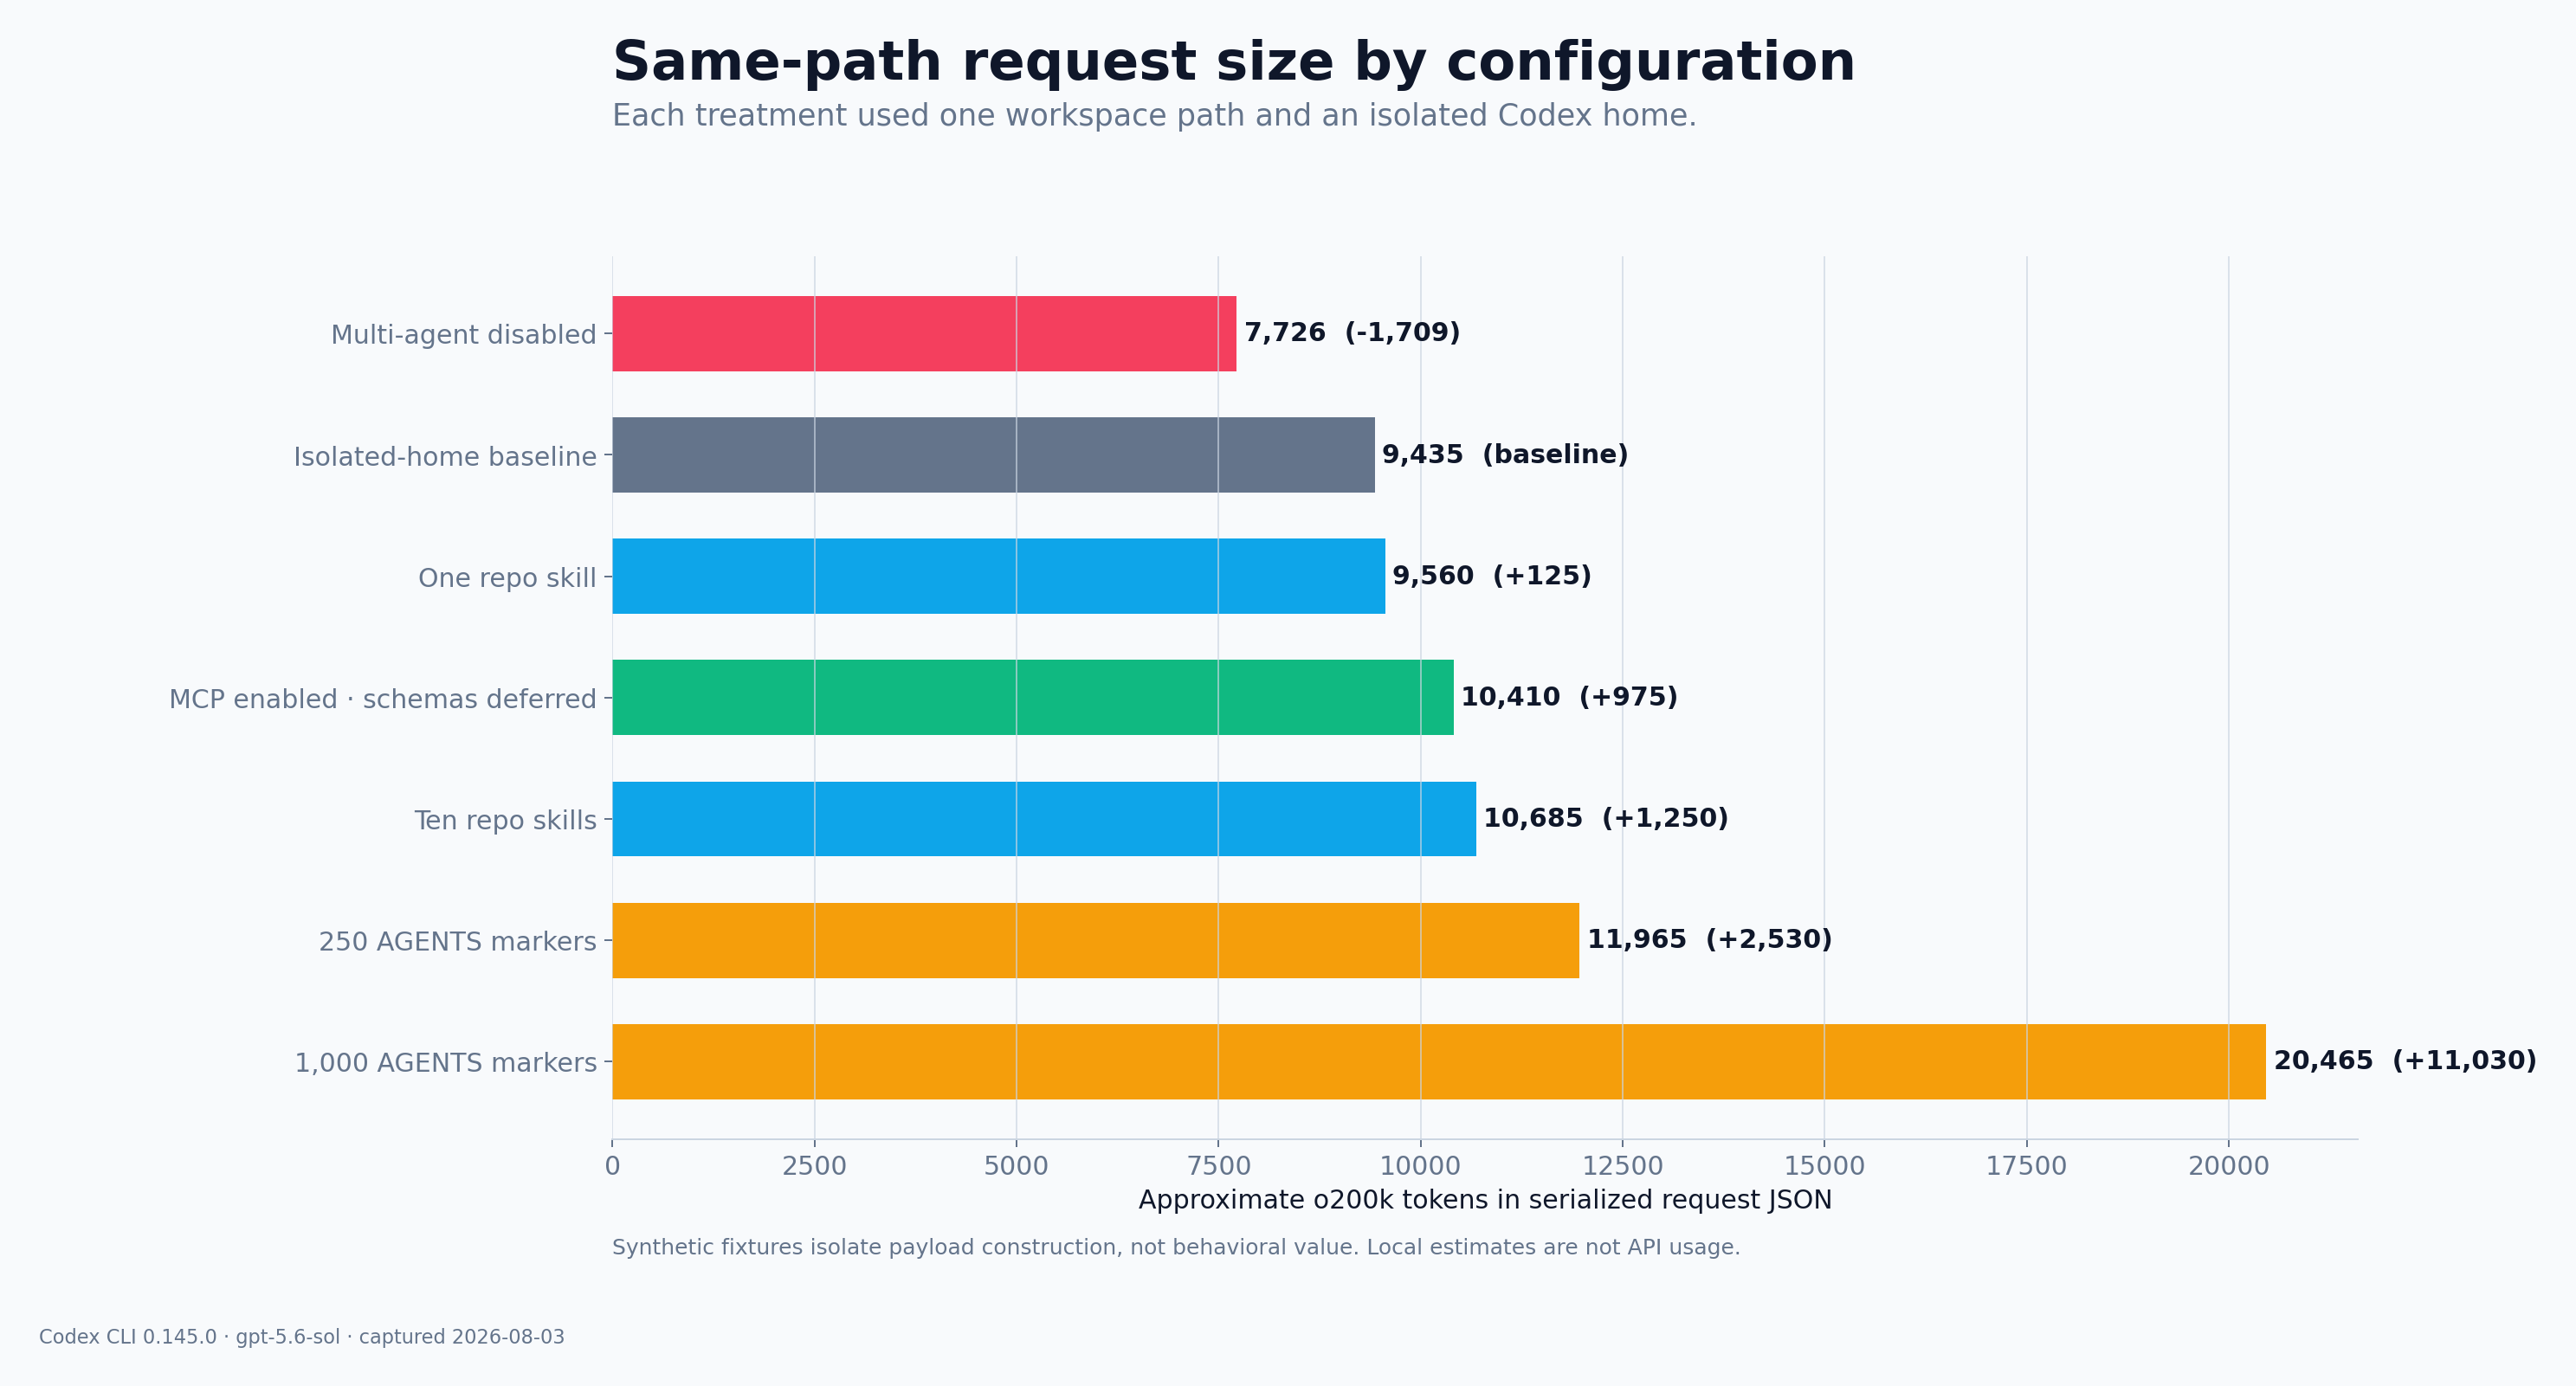
| 250 synthetic AGENTS markers | 48,927 | 11,965 | +5,947 bytes; +2,530 tokens |
| 1,000 synthetic AGENTS markers | 67,177 | 20,465 | +24,197 bytes; +11,030 tokens |
In a two-request trace with 250 markers, all 250 appeared in both requests.
Skills loaded in two stages
Repository skills under .agents/skills/ initially contributed their name, description, and path. Their SKILL.md bodies were absent until read.
Each synthetic skill had a 12-word description and a 200-word body with unique markers.
- One skill added 481 bytes and approximately 125 tokens to the first request.
- Ten skills added 4,810 bytes and approximately 1,250 tokens.
- None of the body markers appeared in either first request.
MCP tool descriptions were deferred
I tested one local MCP server with three tools and two local servers with seven tools in total.
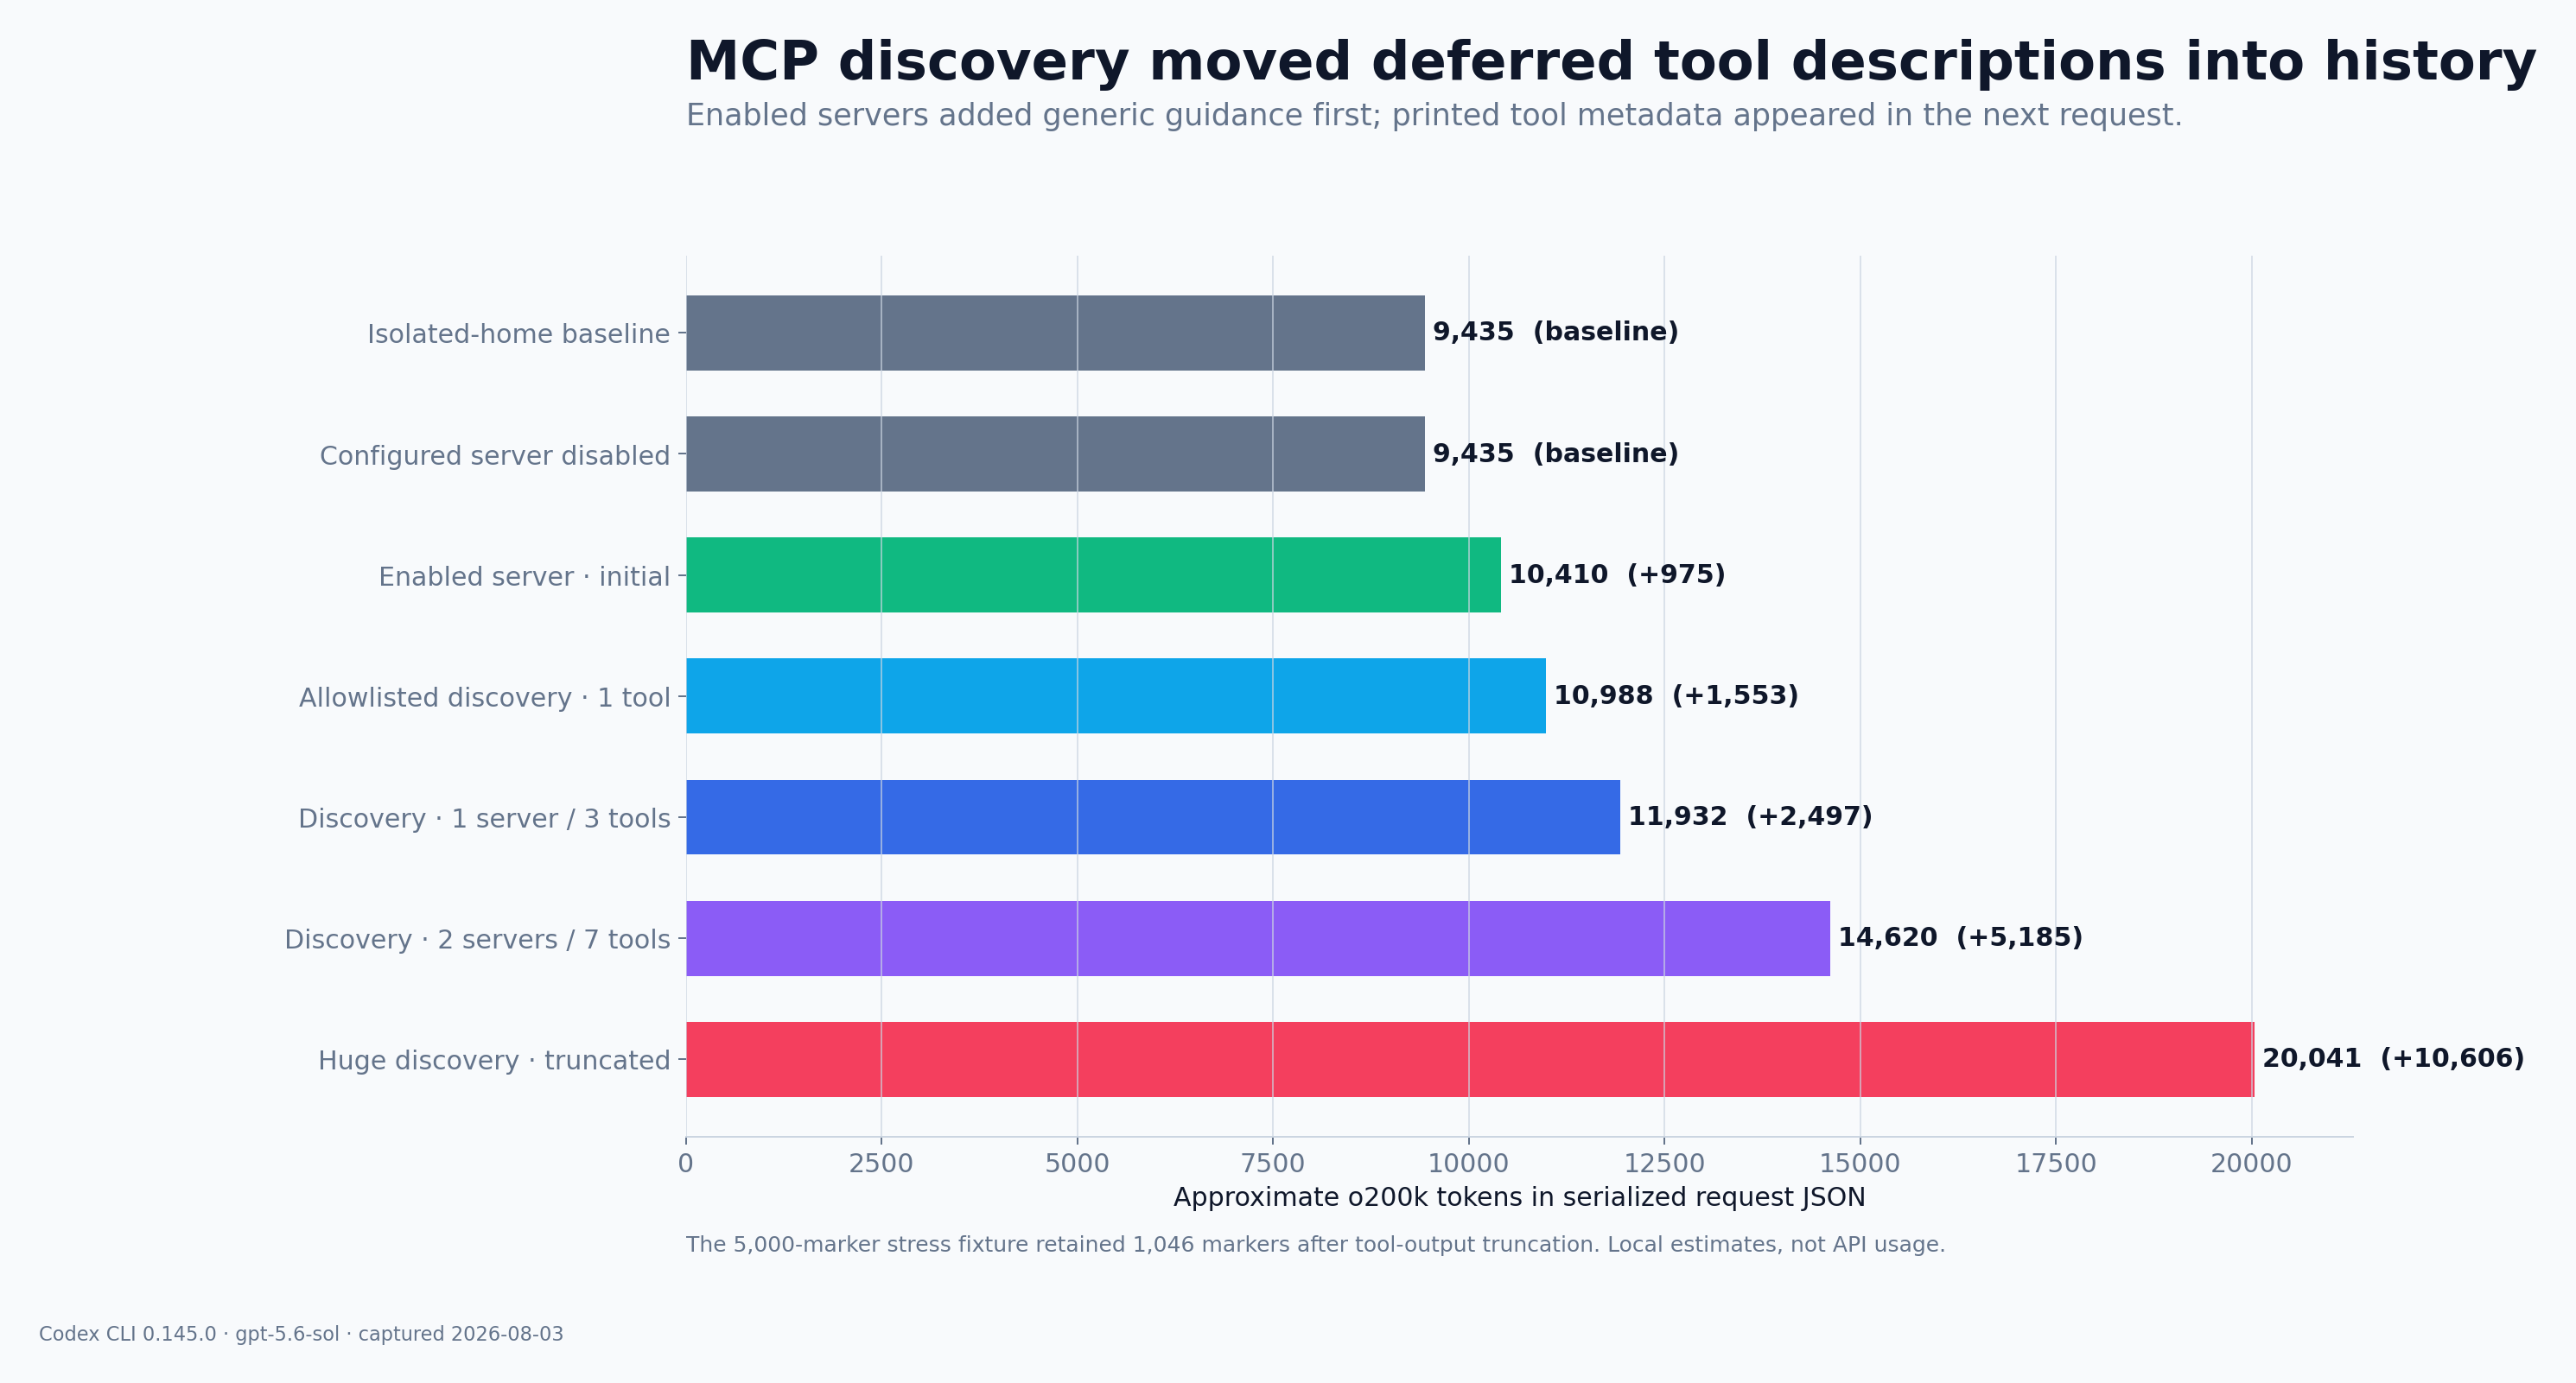
In the initial-only runs, both requests were 46,582 bytes and approximately 10,410 local tokens. Neither contained the custom tool names or descriptions. Instead, the exec interface gained generic MCP discovery guidance. Disabling the configured server returned the request to the isolated-home baseline.
The descriptions appeared after I made exec print the matching deferred tool entries:
| Retained description markers | Added bytes | Added local estimate | |
|---|---|---|---|
| One server, three tools (40 markers each) | 120 | 5,894 | 1,522 tokens |
| Two servers, seven tools (three at 40 markers, four at 60) | 360 | 15,970 | 4,210 tokens |
| One server allowlisted to one tool (40 markers) | 40 | 2,288 | 578 tokens |
These deltas compare the request after discovery with the first request in the same trace, which was 46,589 bytes and 10,410 local tokens in a separate run.
I also created one tool description containing 5,000 markers. After truncation, its retained head-and-tail sample still contained 1,046 markers. The next request grew by 40,607 bytes and approximately 9,631 local tokens.
Observed request size by configuration
MCP discovery moved deferred tool descriptions into history
A coding task, request by request
I created a small Python fixture with a configuration bug: an explicit false value was being replaced by a user default. The task was:
Fix the configuration precedence bug causing explicit false values to be replaced by user defaults. Add a regression test and run the relevant test suite.
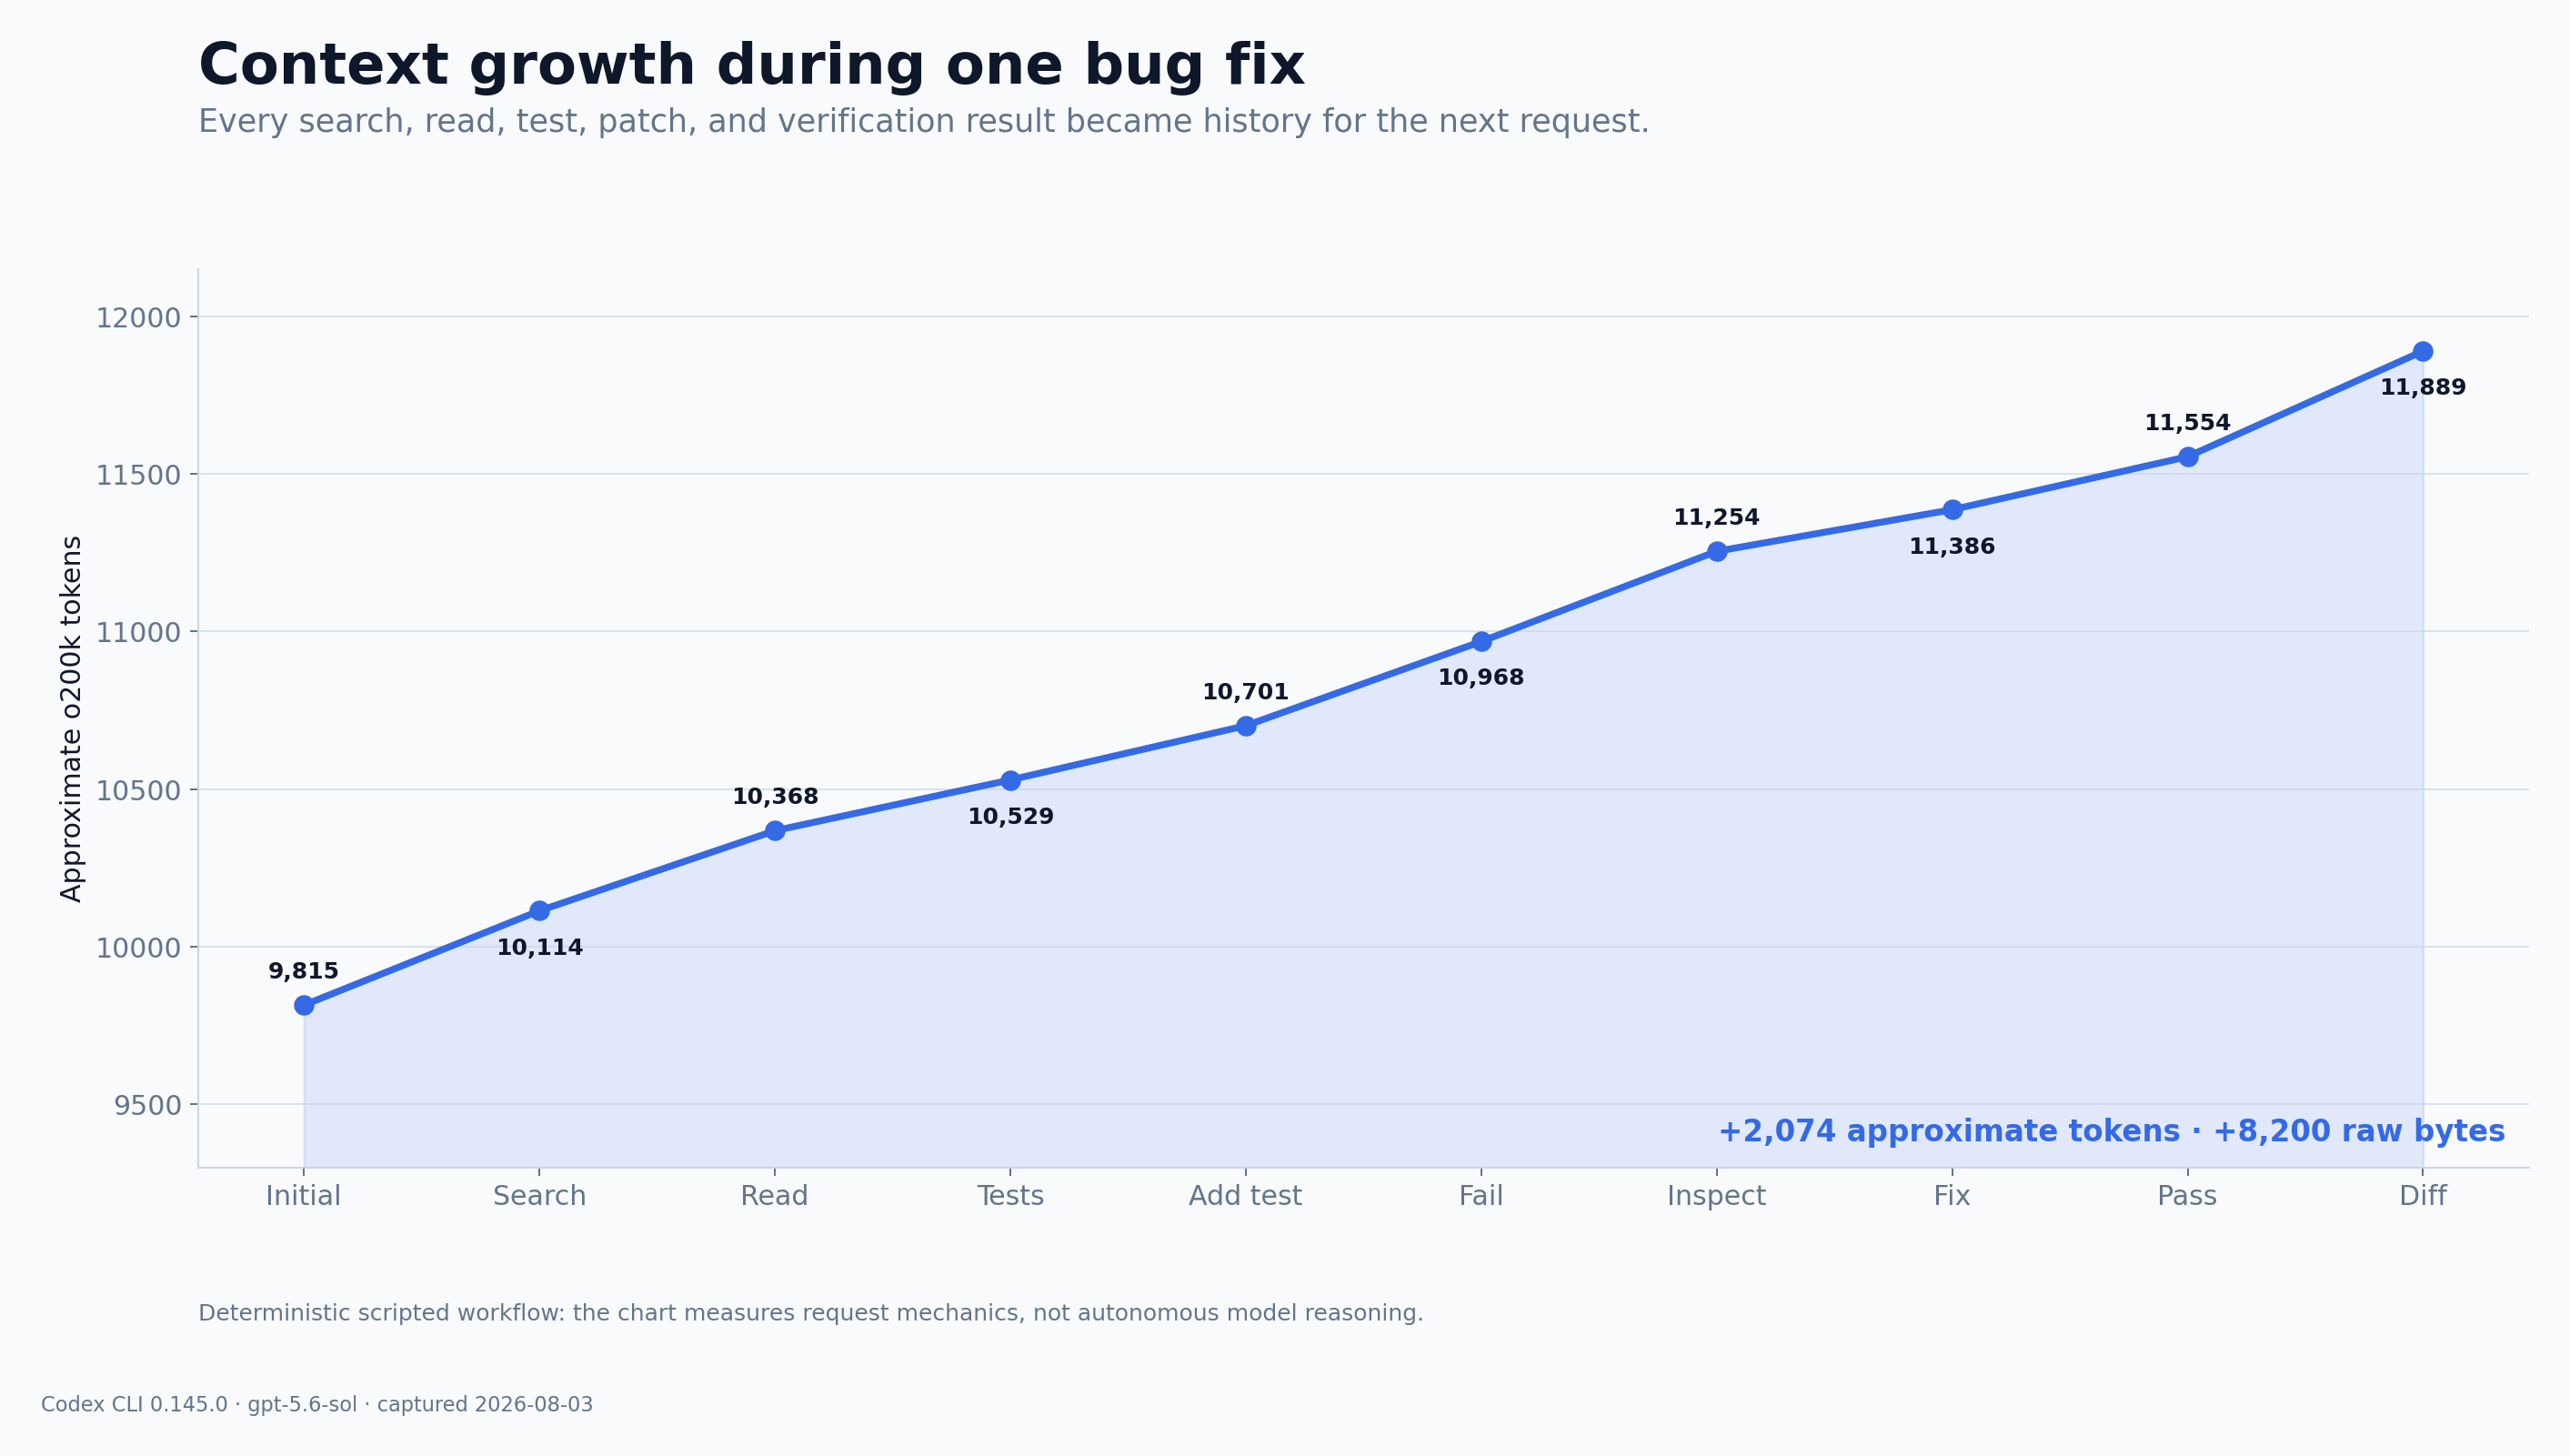
This trace measures request growth, not model reasoning. The actions were fixed in advance.
| Action completed before it | Raw bytes | Local estimate | |
|---|---|---|---|
| 0 | Initial task | 44,189 | 9,815 |
| 1 | Search | 45,289 | 10,114 |
| 2 | File reads | 46,278 | 10,368 |
| 3 | Initial tests | 46,959 | 10,529 |
| 4 | Regression added | 47,635 | 10,701 |
| 5 | Regression failed | 48,832 | 10,968 |
| 6 | Second inspection | 49,953 | 11,254 |
| 7 | Fix applied | 50,471 | 11,386 |
| 8 | Suite passed | 51,170 | 11,554 |
| 9 | Diff verified | 52,389 | 11,889 |
The final request was 8,200 bytes and approximately 2,074 tokens larger than the first. Search results, file contents, tests, the failure, the patch, and the final diff all remained available to later turns.
Context growth during one bug fix
Files entered after they were read
I created five harmless files with unique markers: a normal source file, an ignored file, a fake .env, an ignored 20,000-line log, and a file named inside AGENTS.md.
None of their contents appeared in the first request.
Running rg –files -uu added their filenames, not their contents. After explicit reads, the normal file, ignored file, fake .env, and ignored log all appeared in later requests.
| Raw bytes | Local estimate | |
|---|---|---|
| Before file operations | 43,500 | 9,617 |
| After filename listing | 45,040 | 10,092 |
| After normal-file read | 45,445 | 10,196 |
| After ignored-file read | 45,846 | 10,303 |
| After fake .env read | 46,250 | 10,418 |
| After large ignored-log read | 87,561 | 20,350 |
| After mentioned-file read | 87,983 | 20,461 |
The large log was truncated to a head-and-tail sample before the next request.
Codex did not upload the repository automatically. But .gitignore did not block explicit reads or stop the resulting tool output from entering later requests.
Terminal output stayed in the history
Ten- and one-hundred-line command results survived verbatim into the next requests. A 10,000-line result was truncated to a head-and-tail sample, but the request still grew from 43,337 bytes and approximately 9,584 tokens to 88,480 bytes and 25,835 tokens.
Repeated output was not deduplicated. ANSI-formatted text and a failing Python stack trace also stayed in the history.
Images crossed as data URLs
A synthetic 32×32 PNG appeared in the request as a 442-character data:image/png;base64,… URL.
I then attached a larger synthetic gradient PNG. Codex resized and re-encoded it before transmission. The captured 71,666-character data URL decoded to a 1600×1600 PNG. A two-image request contained both data URLs.
The raw request bodies were 43,955 bytes for the small image, 115,265 bytes for the transformed large image, and 115,886 bytes for both. Local text tokenization of base64 is not image-token accounting, so I did not use it to estimate cost.
Compaction sent the history through another request
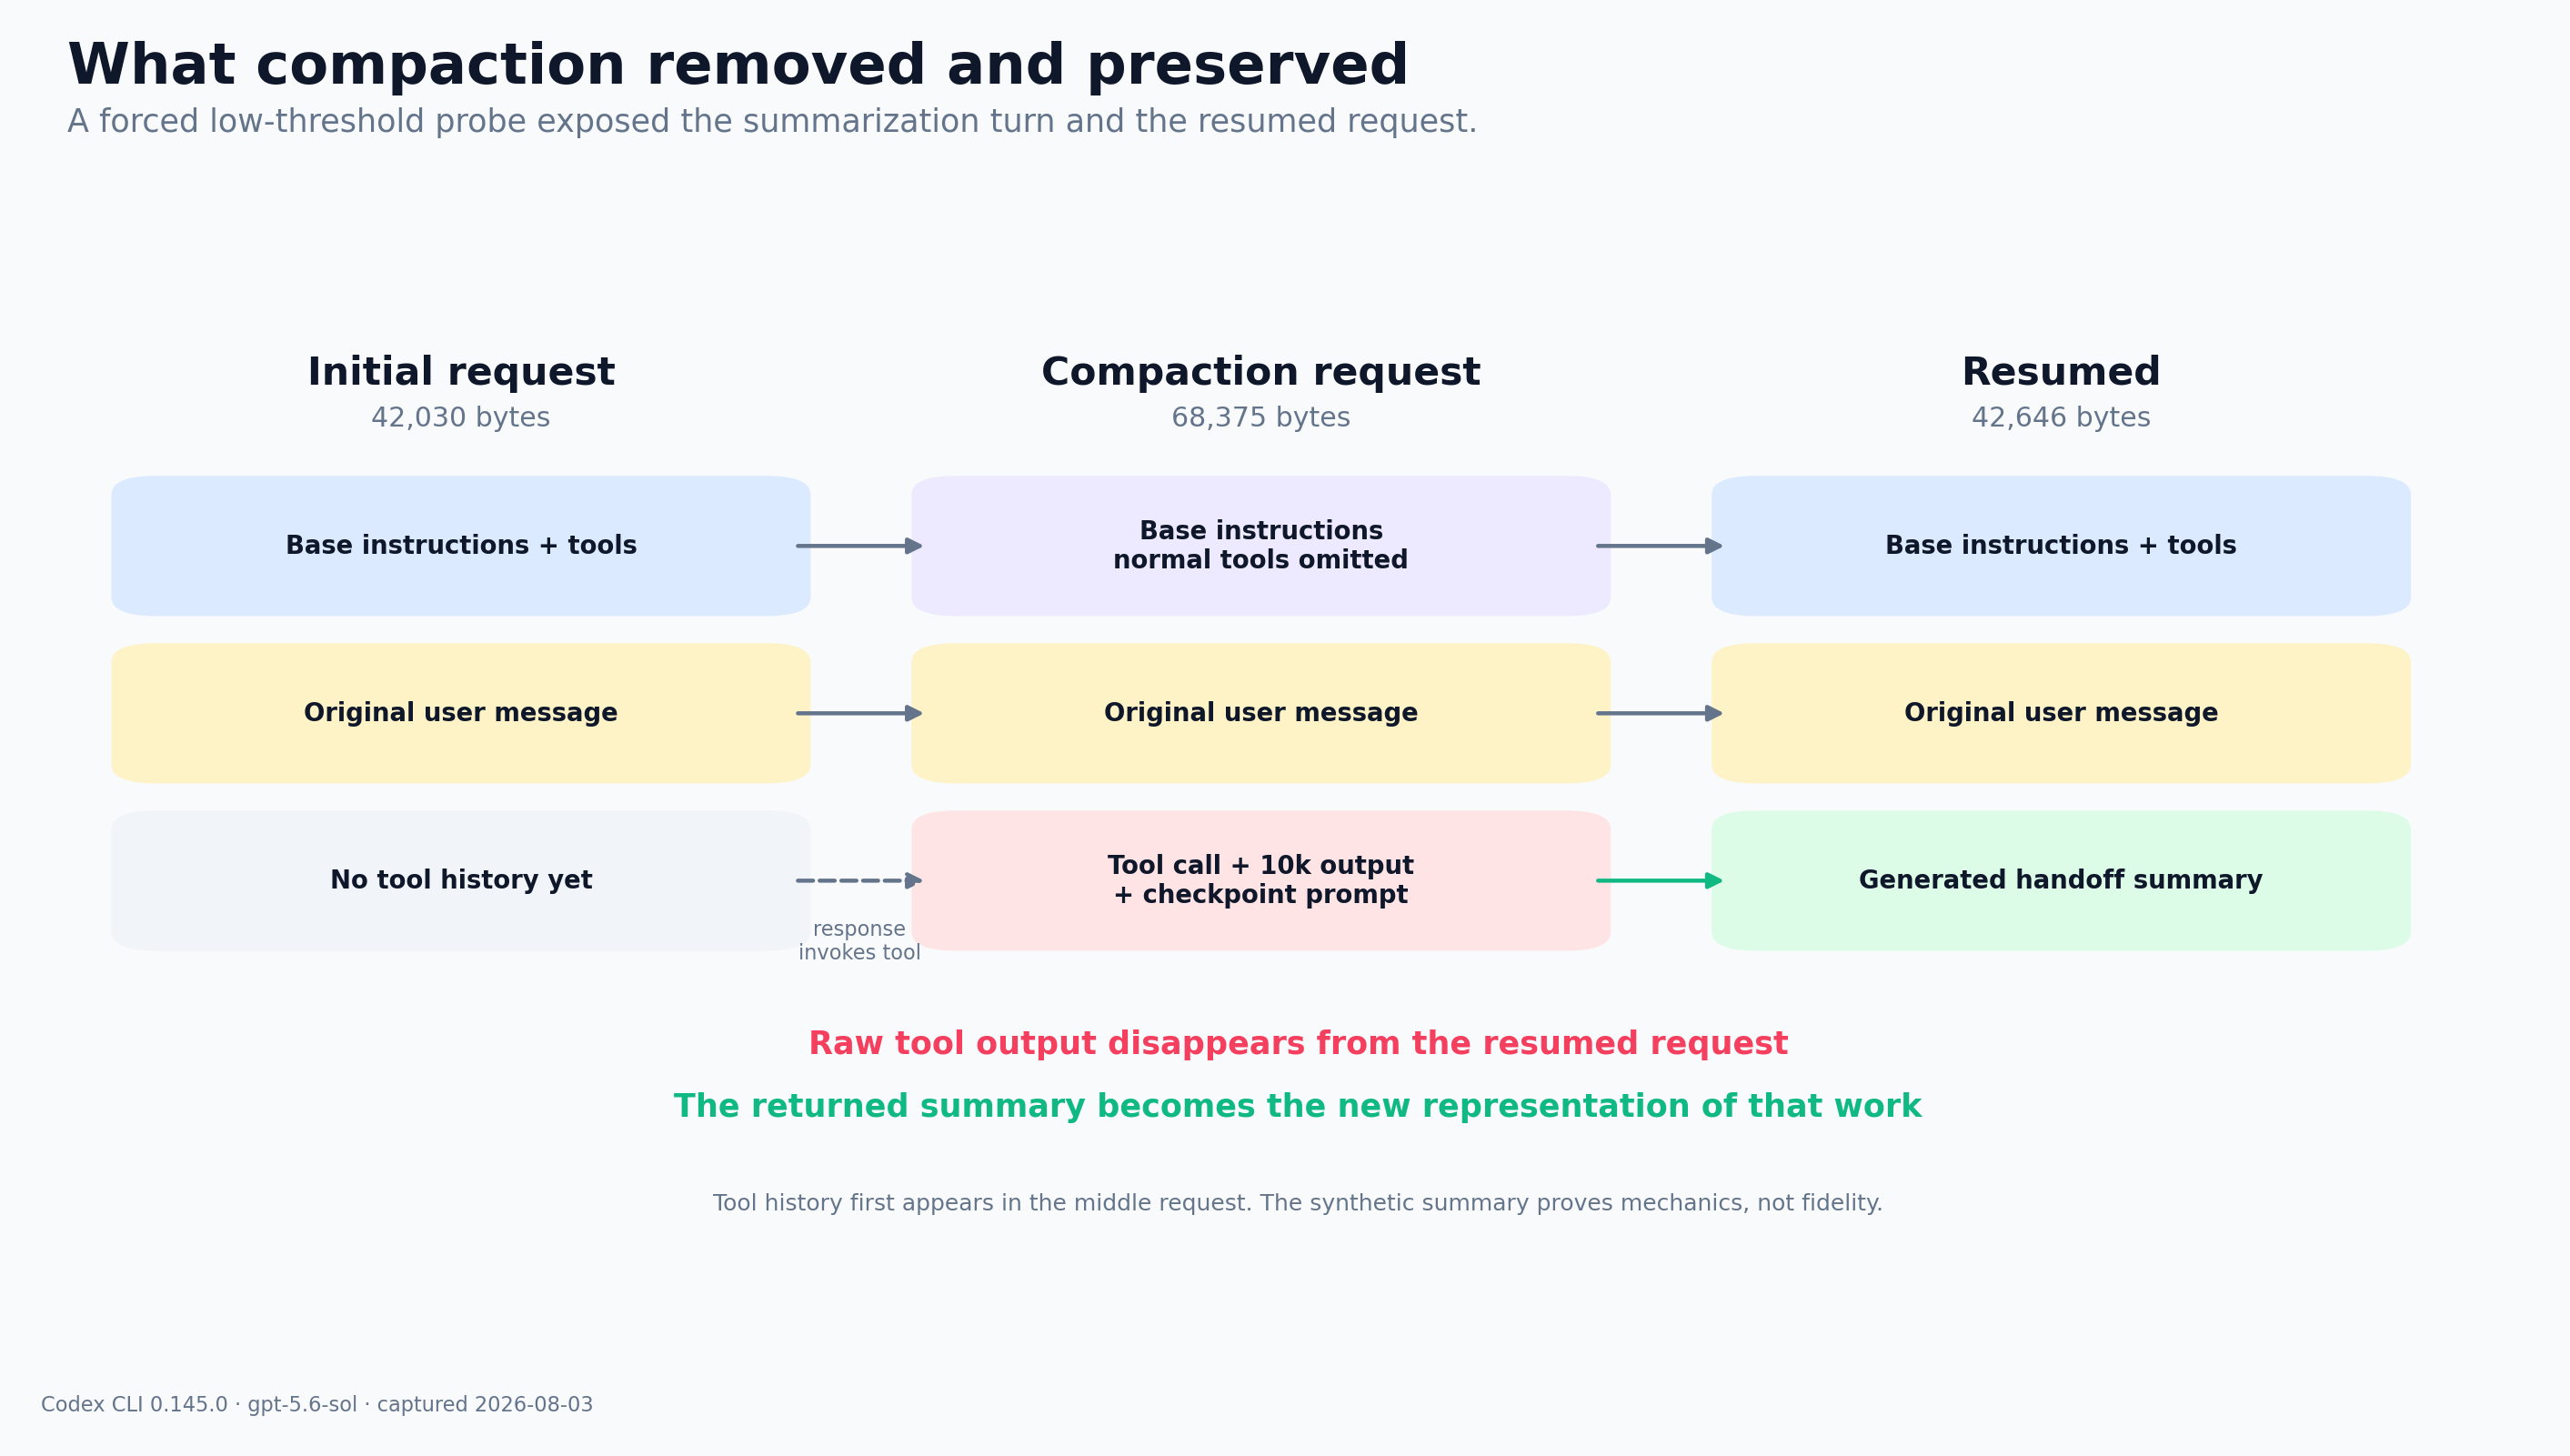
Against OpenAI or Azure, Codex compacts through a dedicated endpoint. Against a custom provider like my recorder, it builds the summary request itself. That is the path I captured, and it had two stages. First, Codex sent the accumulated history with a summary prompt. It then rebuilt the conversation around retained user messages and the returned summary. The code is in the compaction request and history replacement paths.
I forced the trigger with synthetic usage: 13,000 reported input tokens, a 20,000-token context window, and a 12,000-token compaction threshold.
That produced three requests:
- Initial request: 42,030 bytes and approximately 9,378 tokens. It contained the normal tools and user request.
- Compaction request: 68,375 bytes and approximately 21,408 tokens. It contained the accumulated history, a large retained tool result, and a summary prompt. The normal tool list was empty.
- Resumed request: 42,646 bytes and approximately 9,500 tokens. The normal tools and original user message returned. The raw tool call and output were replaced by the synthetic summary.
What compaction removed and preserved
The resumed request was 25,729 bytes and approximately 11,908 tokens smaller than the compaction request. The summary was intentionally short.
This shows how the history was replaced, not how well a real model would summarize it. After compaction, a detail may survive only through the generated summary rather than the original message or tool output.
What crossed the machine boundary
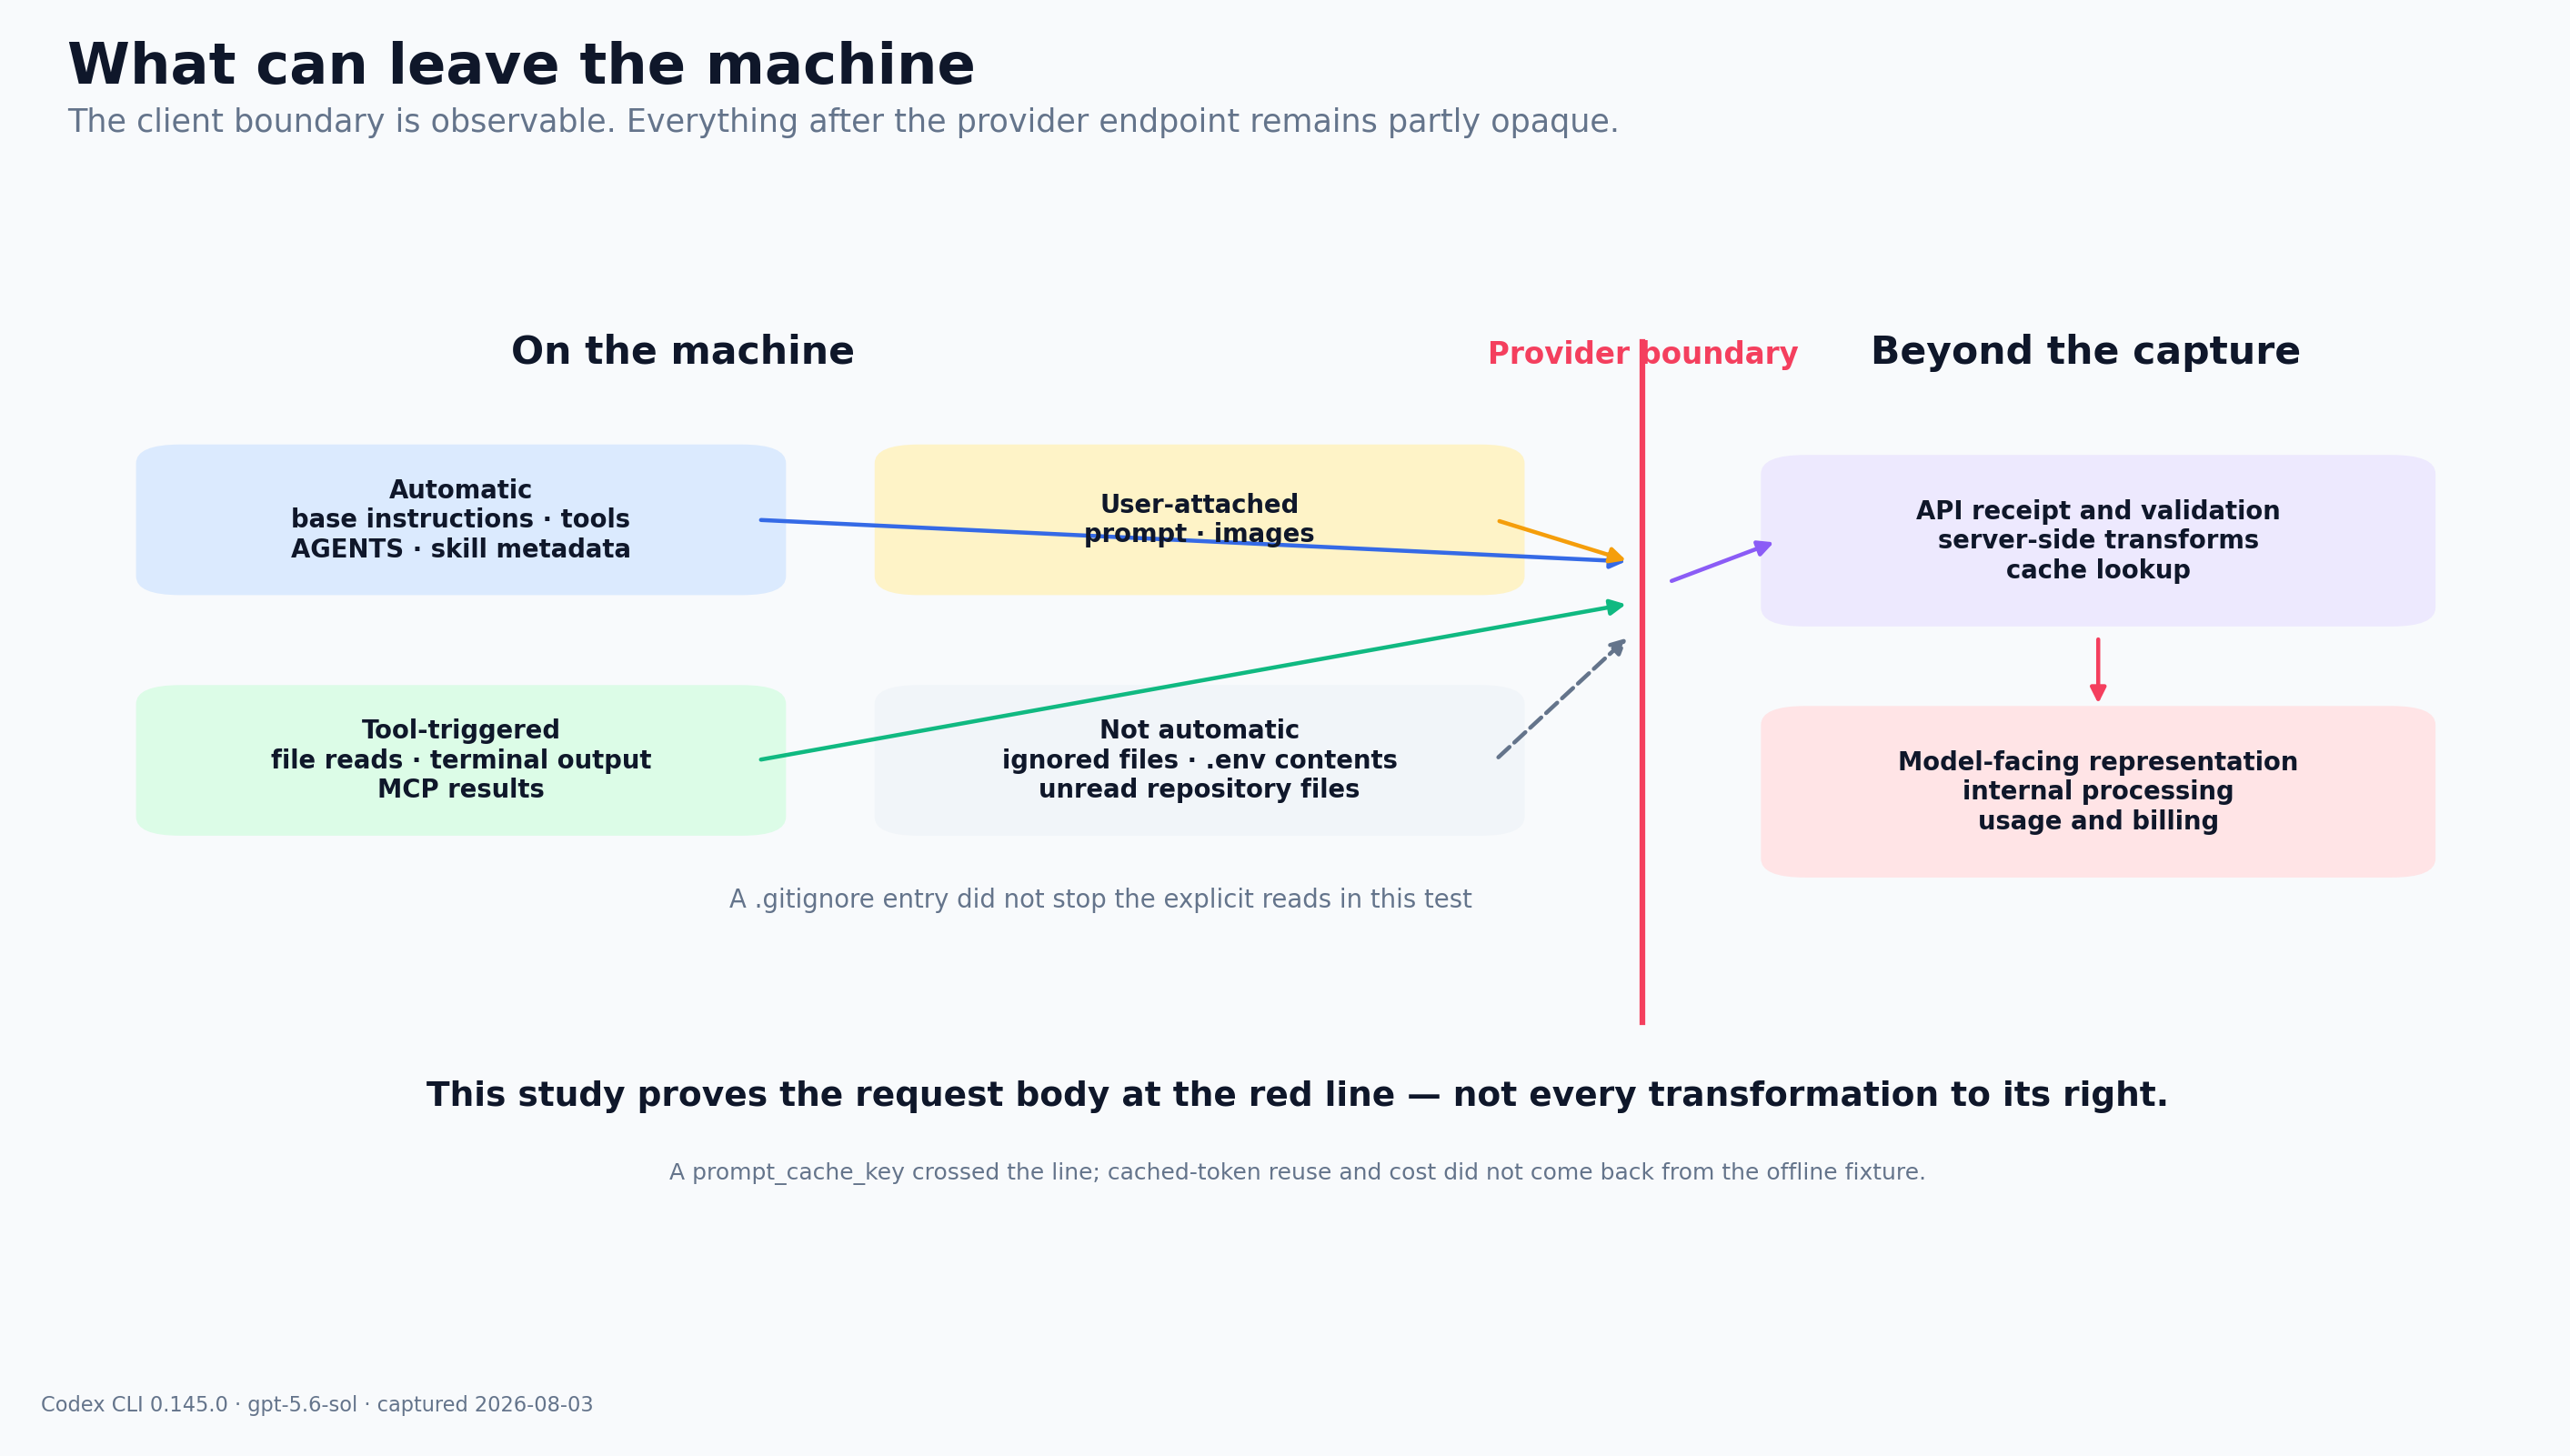
Some information was present before any tool use: Codex instructions, visible tool interfaces, the discovered AGENTS.md chain, skill metadata, environment context, and the user prompt.
Other information appeared only after an action: file contents after a read, terminal output after a command, MCP descriptions after discovery, and images after attachment.
Unread repository files, ignored files, and the fake .env did not appear automatically. The prompt was the seed. The request was the working state.
What can leave the machine
What this experiment did not measure
- A universal minimum request across every Codex version, model, operating system, or product surface.
- Autonomous model reasoning. The multi-turn workflows used fixed fake responses, so real sessions carry more per turn than these traces show.
- The quality of model-generated compaction summaries.
- Provider-side transformations, cache hits, billing, or model internals.
The companion artifact pack contains the recorder, sanitized request bodies, analysis files, tests, and figure sources.
Feedback is extremely welcome. If any of this interests you, please reach out on X. I love making new friends.